Data tables to visual charts
9th Jan 2008
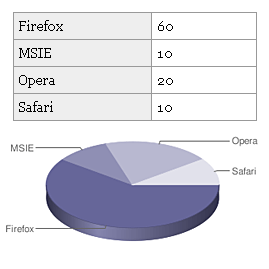
Christian Heilmann has penned a decent script that generates charts from accessible data tables using the Google Chart API. Example here.
Possibly related?
Based on the tags from this post.
Data Table Accessibility Test Page
Roger Hudson and Russ Weakley have been studying how people who rely on screen readers use a range of data tables. These observations confirm the ne [...]
- up ↑
- accessibility
- 5th Jul 2005
Accessible Data Tables
Thorough article by Roger Hudson on how to create accessible data tables. [...]
- up ↑
- accessibility
- 14th Sep 2005
Follow me on Twitter

- up ↑
- social networking
- 25th May 2012
Sound Toys

- up ↑
- audio visual
- 25th Jul 2008
The Turn
- up ↑
- audio visual
- 17th Jun 2009


