
A Visual History of Loudness
9th Jan 2010
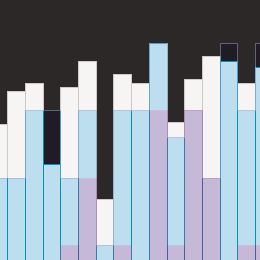
A Visual History of Loudness (PDF) is a fascinating project by Christopher Clark. He measured the peak levels of three hit songs a year over the past three decades and created a chart to illustrate how the volume of music has risen steadily. More details at NPR.
Possibly related?
Based on the tags from this post.

35mm

- up ↑
- audio visual
- 21st Jul 2010